This blog post accompanies episode 10 of Linux Matters Podcast where I talked about this subject for a bit. You can listen to the episode here once it’s out. If you’re a Patron you can listen ahead of time, and with no adverts.
Hackathon
In July at work, we had a short mid-week internal Hackathon. Everyone was encouraged to take part if they could. Here’s the blurb to introduce it, taken from our internal Notion.
So we (optionally) ‘down tools’ on current projects and come up with something interesting to work on which uses or builds upon Axiom. We have a lot of talented and imaginative engineers on staff, who came up with fun projects.
For those not in the know, Axiom is a platform built from the ground up to enable you to understand, report and alert on time-based event data. Think logs, traces, metrics, queried with a super-fast modern language, building dashboards, and alerting when things go wrong. </ad>
I decided to put all the charging data from my electric car into Axiom and see what I could do with it. Axiom is designed for enterprise organisations to send and query huge volumes of data. But there’s a free tier that has generous limits that I’m never going to hit with this project.
EV ownership

I’ve had my Mini EV since December 2021. As an insufferable “new” EV driver, I am of course compelled to talk about it at any opportunity.
Seriously though, in social situations, when people find out you have an EV, there are a bunch of common questions you get asked. They are often keen to know the actual range, how the car is charged up, where you charge, and how often. They also often want to know all the costs associated with running the car and may get into more details about any of these topics.
Some of the questions only need rough answers. The manufacturer’s expected range and what I tend to get in the real world are easy to articulate. Questions about how often I charge, and where, aren’t as straightforward. I have a charger at home, and plug in most of the time, but how often is “most of the time”, what happens and where do I charge when away from home?
I have a terrible memory, so don’t have that kind of information to hand. In the early days of having the car, I kept a spreadsheet of all the times I’d charged the car. That lasted about nine months before it got boring and I stopped updating it though.
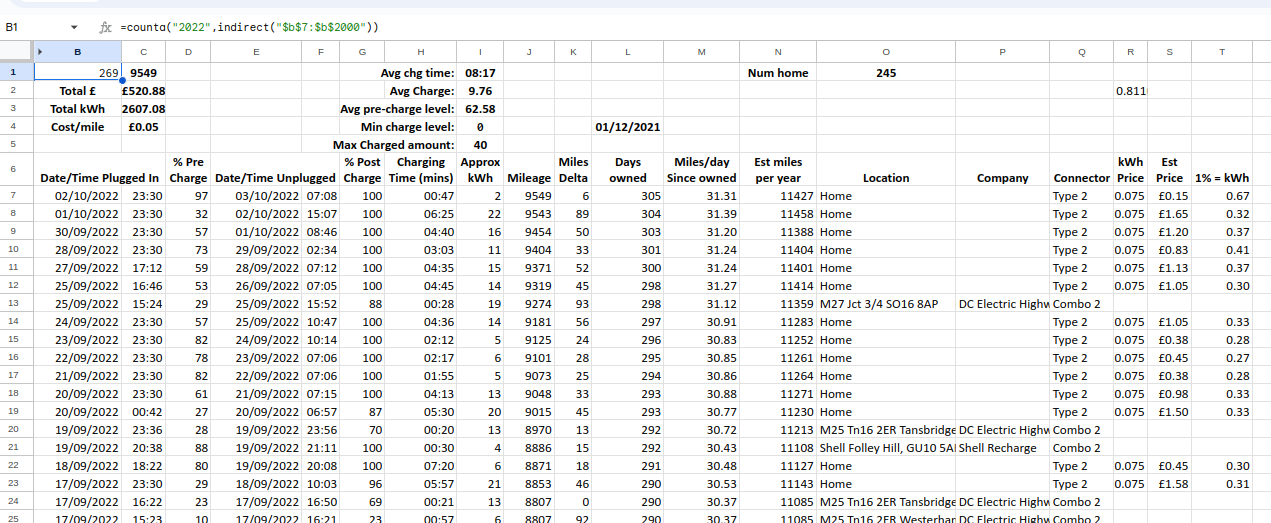
The good news however, is BMW (the manufacturer of my car) has a secure portal where I can download a “takeout-style” archive of all charging events. Given I only want to report on the historical charge data for my eighteen months of ownership, this was perfect.
Note: When I explained this data retention and availability to a friend they were somewhat horrified. I opted into this service when I connected the car to the official Mini mobile app. I imagine if I didn’t register, BMW likely wouldn’t have the data, or at least wouldn’t have it associated with me. Many modern cars do this, these days. This isn’t an Austin 11.
Getting the data
I requested the “cardata” archive from BMW on Monday, and received an email with the link within twenty-four hours, on Tuesday morning.
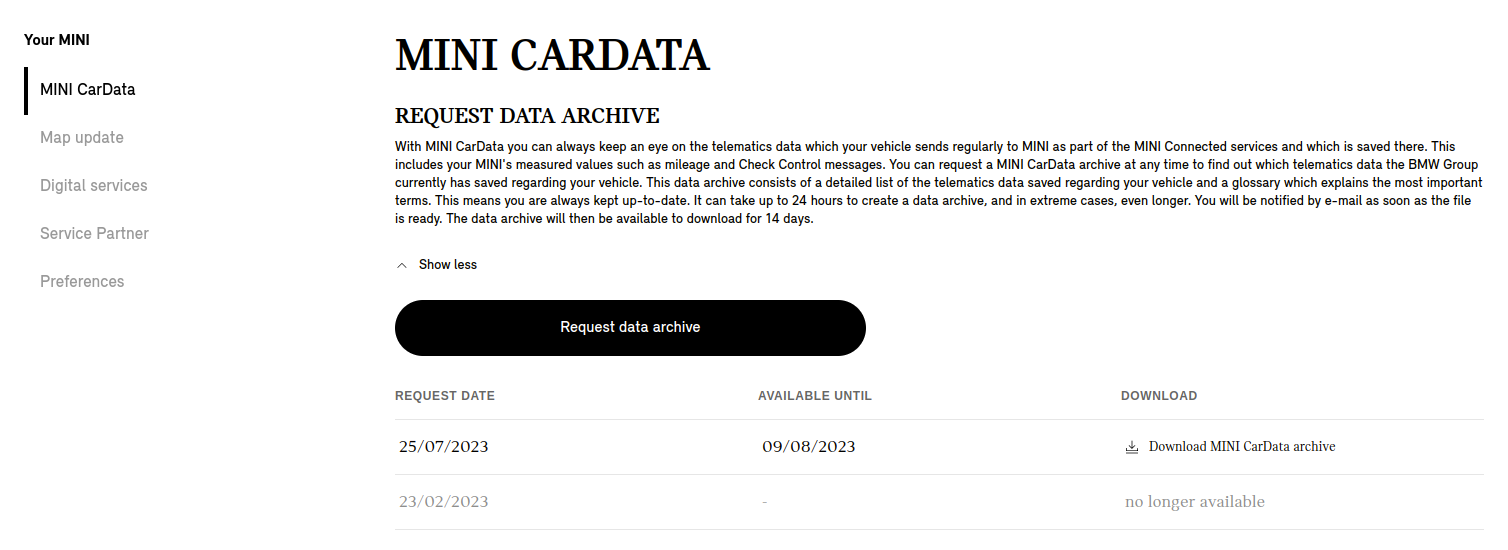
The payload is a zip containing an HTML page explaining the contents, and links to the other files in the archive.
An XML file details all known telematics data about the car itself. This includes the base and optional features of the vehicle. It also details the current state of sensors, such as whether the doors, windows, boot or bonnet are open. The XML file also has a vehicleImage field which contains a base64-encoded PNG render of the car, which you can see further up in this article.
A PDF MINICarDataTelematicsDataCatalogue.pdf documents all the fields and their meanings in the other files.
The most interesting file (to me) though is MINI-CarData-ChargingHistory_(myVIN)_24-07-2023.json which has all the good stuff I’m after. It contains a record of each time the car was charged, going back to the start of my ownership.
Technically it goes back to a few days after I got the car. There was an issue registering the car in the Mini app, so it didn’t have a record of the first week or so of charging data. It has every data point since then though.
Here’s a sample record from that file. You may be able to note on this occasion in November 2022 (startTime) we charged from 70% (displayedStartSoc) to 86% (displayedSoc), taking 6.44kWh (energyConsumedFromPowerGridKwh) from the grid in about 9 minutes (endTime - startTime).
I think we call that a “splash n’ dash”.
    {
        "chargingLocation": {
            "formattedAddress": "B4122, Chippenham, SN15 5",
            "mapMatchedLatitude": 51.51422,
            "mapMatchedLongitude": -2.10974,
            "municipality": "Chippenham",
            "streetAddress": "B4122"
        },
        "displayedSoc": 86,
        "displayedStartSoc": 70,
        "endTime": 1668896458,
        "energyConsumedFromPowerGridKwh": 6.44,
        "energyIncreaseHvbKwh": 6.44,
        "isPreconditioningActivated": true,
        "publicChargingPoint": {
            "potentialChargingPointMatches": [
                {
                    "city": "Chippenham",
                    "postalCode": "SN15 5LH",
                    "providerName": "HPC/DC IONITY GmbH",
                    "streetAddress": "Chippenham Pit Stop Oakleigh Acres"
                },
                {
                    "city": "Chippenham",
                    "postalCode": "SN15 5LH",
                    "providerName": "HPC/DC IONITY GmbH",
                    "streetAddress": "Chippenham Pit Stop Oakleigh Acres"
                },
                {
                    "city": "Chippenham",
                    "postalCode": "SN15 5LH",
                    "providerName": "HPC/DC IONITY GmbH",
                    "streetAddress": "Chippenham Pit Stop Oakleigh Acres"
                }
            ]
        },
        "startTime": 1668895916,
        "timeZone": "Europe/London",
        "totalChargingDurationSec": 542
    },
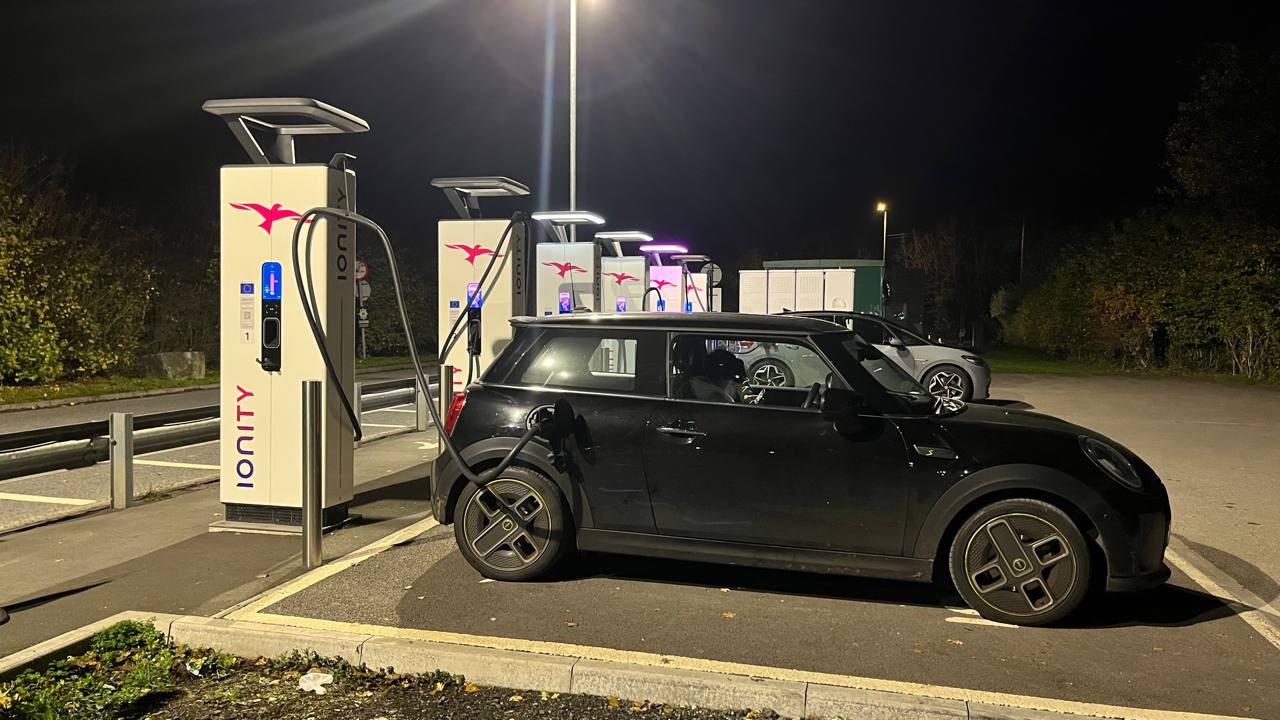
Here’s the car in situ at that location, on that day in November 2022. As you can see from the JSON there are multiple chargers at the same locale. The archive doesn’t say which one I used, but I don’t think that matters too much for my purposes.
Ingesting data to Axiom
This is the easy bit!
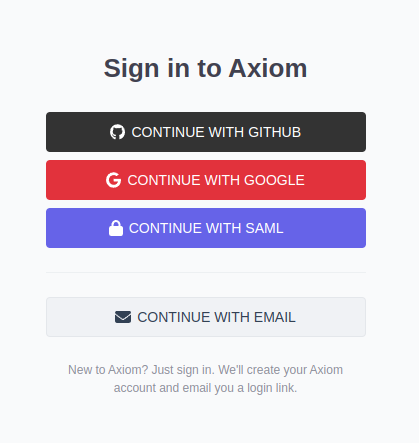
Sign up
I already have an account but creating a new one is pretty straightforward. Visit app.axiom.co, click the buttons and follow the flow.
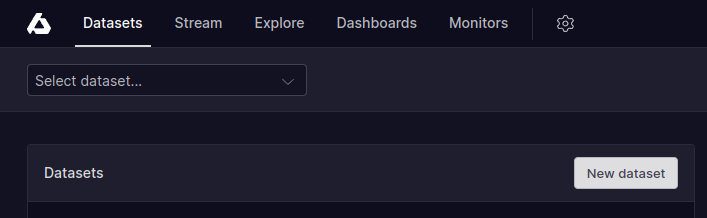
Create a dataset
Data you ingest into Axiom is held in Datasets.
Create one by going to app.axiom.co -> Datasets -> New Dataset.
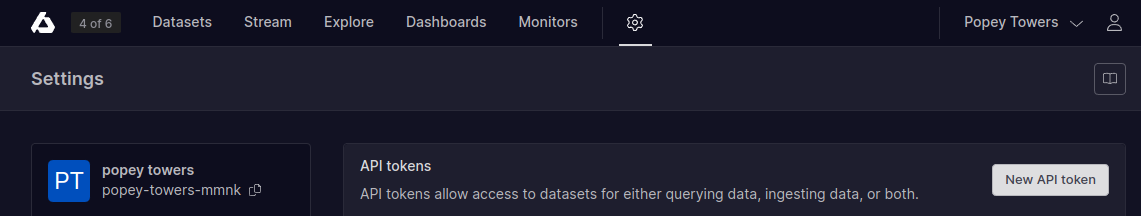
Generate a key
Create an API token to programmatically ingest data into the dataset.
⚙️ -> API tokens -> New API token
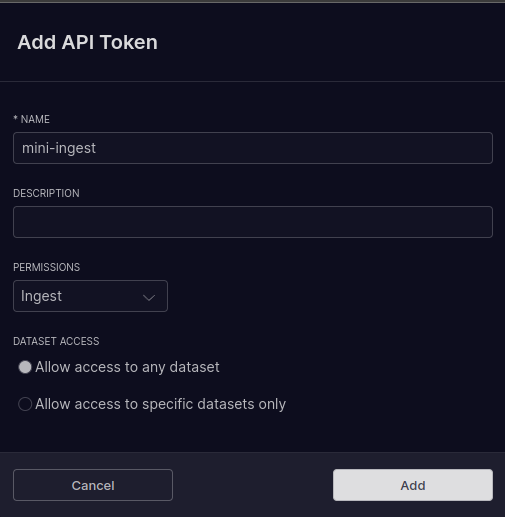
Give the API token a name, and set permissions accordingly.
Either allow access to any dataset or limit to a subset.
Send it!
There are a bunch of ways to ingest data into Axiom if you’re sending from a go, node, NextJs or Python application.
I chose to just throw it in with everyone’s favourite API-tool ✨curl✨. Set $DATSET_NAME and $API_TOKEN accordingly
curl -X 'POST' 'https://api.axiom.co/v1/datasets/$DATASET_NAME/ingest' \
  -H 'Authorization: Bearer $API_TOKEN' \
  -H 'Content-Type: application/x-ndjson' \
  -d @./MINI-CarData-ChargingHistory_(myVIN)_24-07-2023.json
Quick check
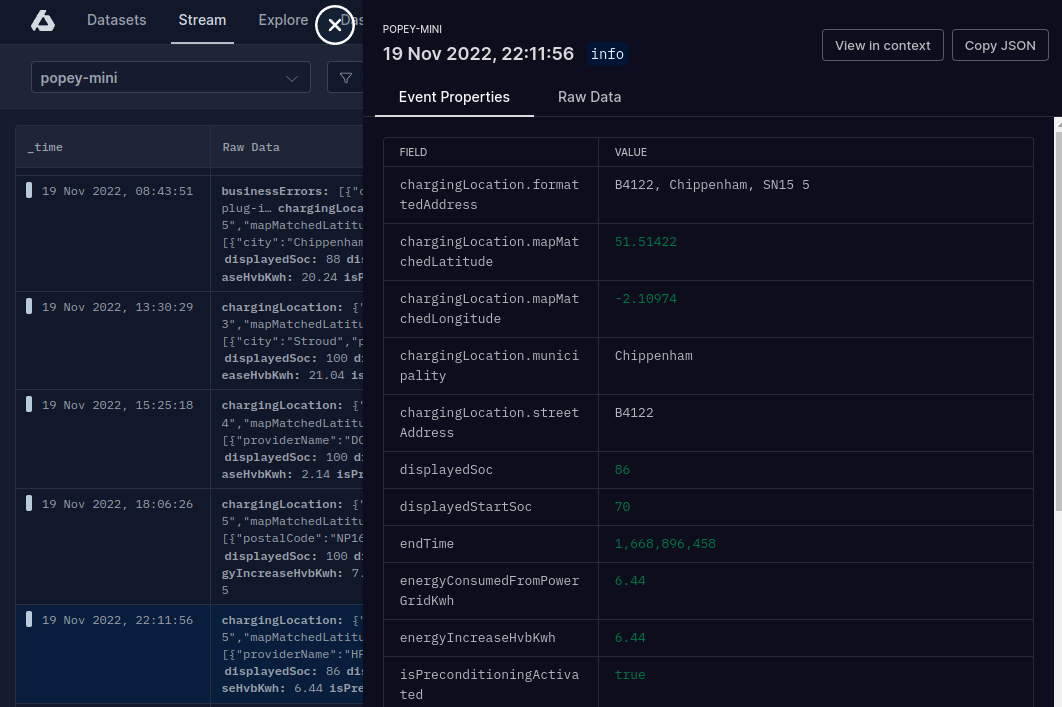
Before we dive into the data, the ‘Stream’ tab enables us to look at the raw JSON as it came in.
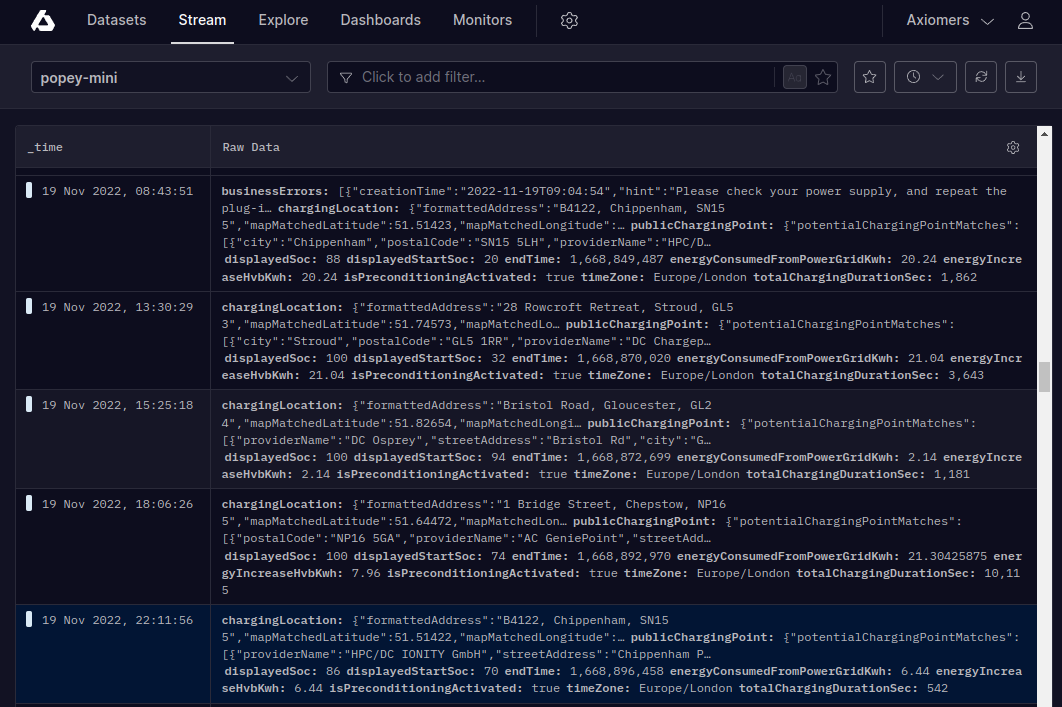
Click on a record in the dataset to see all the fields and their contents. This is a good way to determine if the Axiom ingest process is identifying the field types correctly - it is.
Querying the dataset
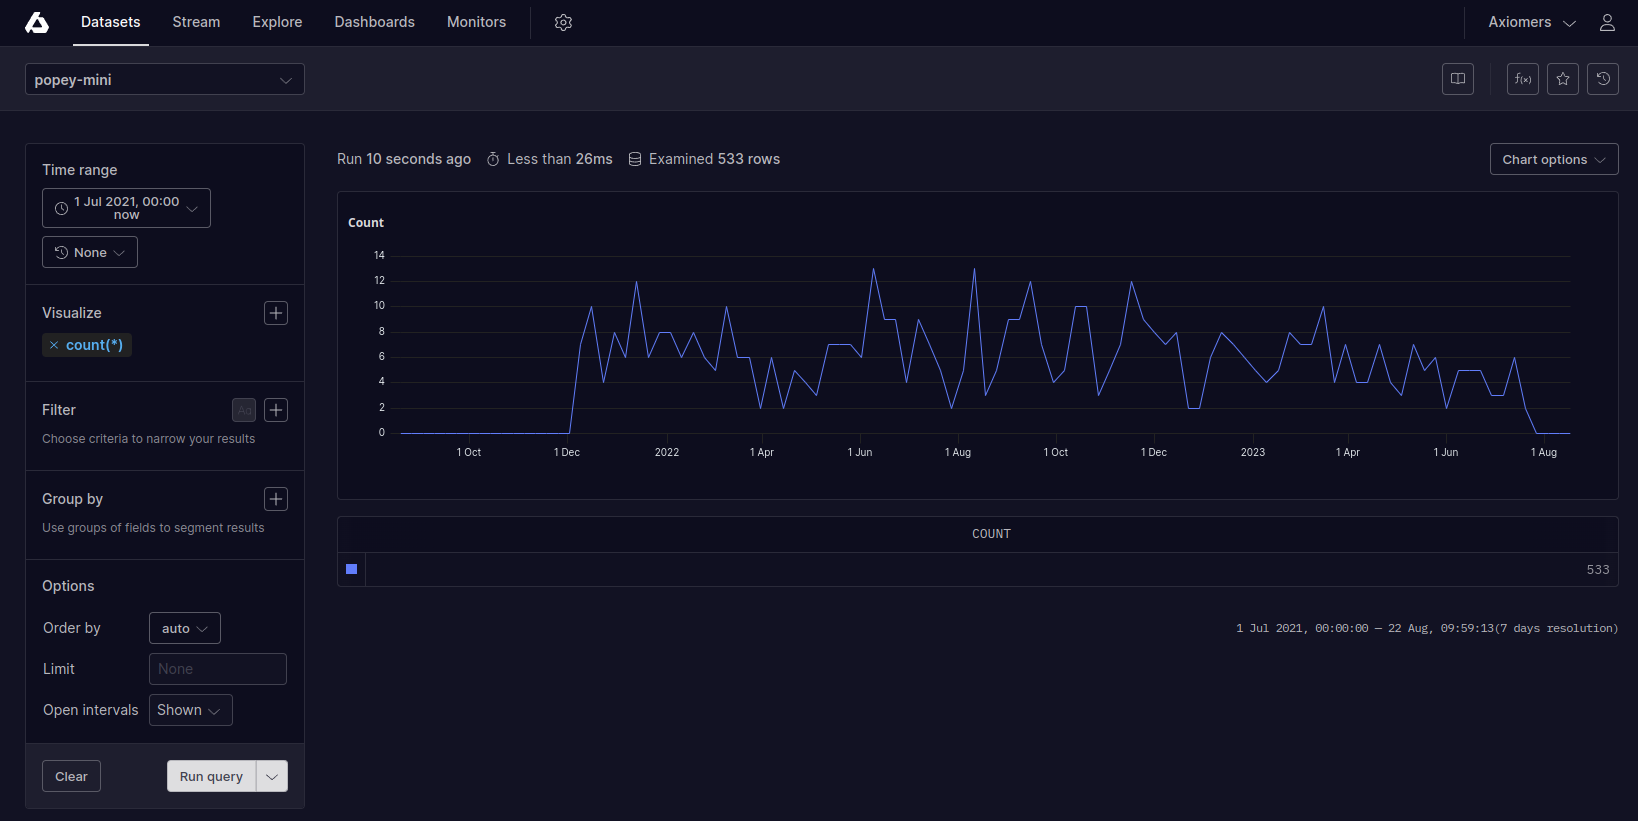
In Axiom you can just use the point-and-click web ui to interrogate your dataset. Here I selected the entire time range and just asked for a count of all records. It’s super fast and easy to query like this.
Once you have a working query, you can save it, and/or build a dashboard from it. Under the covers, the queries are written in APL…
APL
APL (Axiom Processing Language) is the query language used to dig into datasets. The web user interface has a point-and-click interface to build queries as a starting point, then you can refine them in a query editor. Once you’re happy with the query, you can add them to a dashboard.
Answering the questions
During the hackathon, I wanted to answer some questions I get a lot, mostly around charging - as those topics often come up.
Home or Away
I frequently get asked how expensive it is to charge away from the house, and how often I have to do it. The dataset doesn’t currently contain pricing data, and each charger is different, with pricing changing over time. I haven’t figured out how to map the pricing data here yet.
I have sometimes used public chargers since owning the car, but how often?
APL makes this pretty easy.
First, how many records are there in total? This is the equivalent APL query as shown the image immediately above.
['popey-mini']
| summarize count()
Result: 533
['popey-mini']
| where not(['chargingLocation.streetAddress'] contains "my home street name")
| summarize count()
Result: 74
['popey-mini']
| where ['chargingLocation.streetAddress'] contains "my home street name"
| summarize count()
Result: 459
So, around 14% of the time I charge away from home, and around 86% of the time I’m charging on my infrastructure.
Home
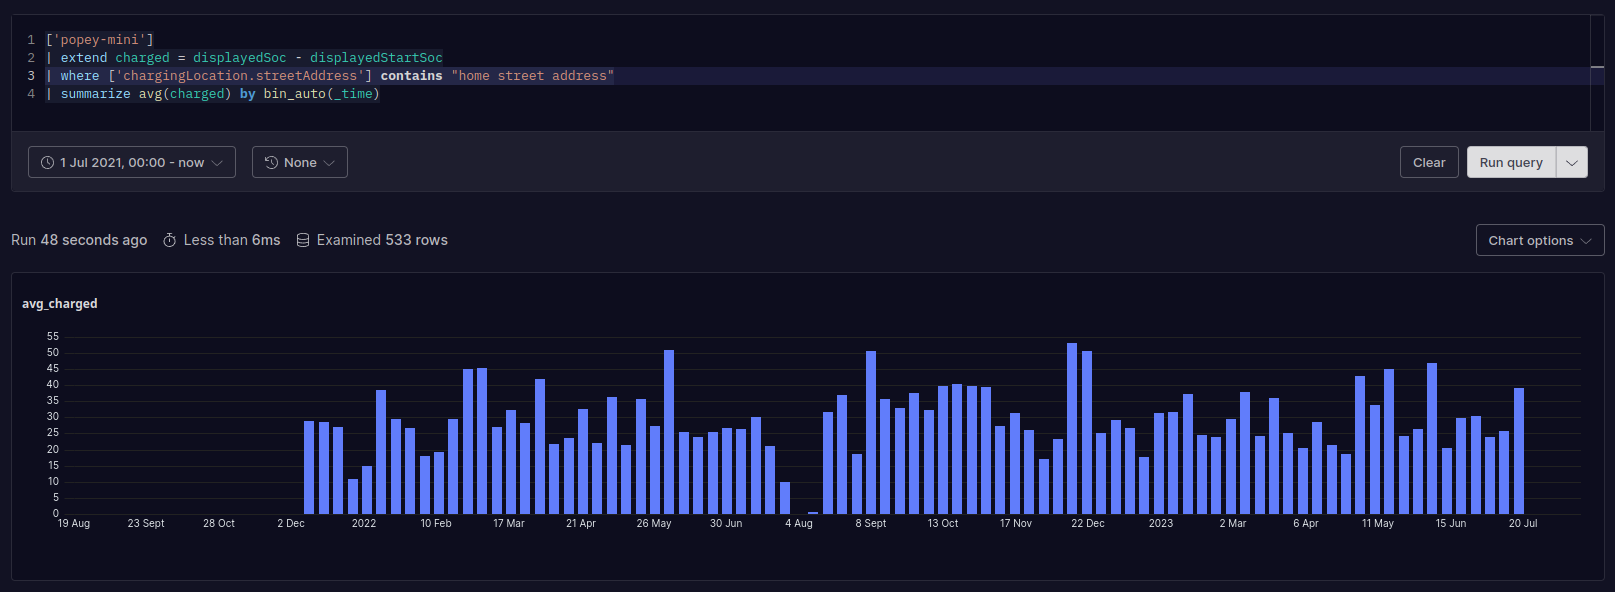
That’s all very simple, how about a chart?
Let’s see how much we charge at home. I determine if the entry is at my home by looking at the chargingLocation.streetAddress field, charting the percentage I charged on each occasion.
['popey-mini']
| extend charged = displayedSoc - displayedStartSoc
| where ['chargingLocation.streetAddress'] contains "my home street name"
| summarize avg(charged) by bin_auto(_time)
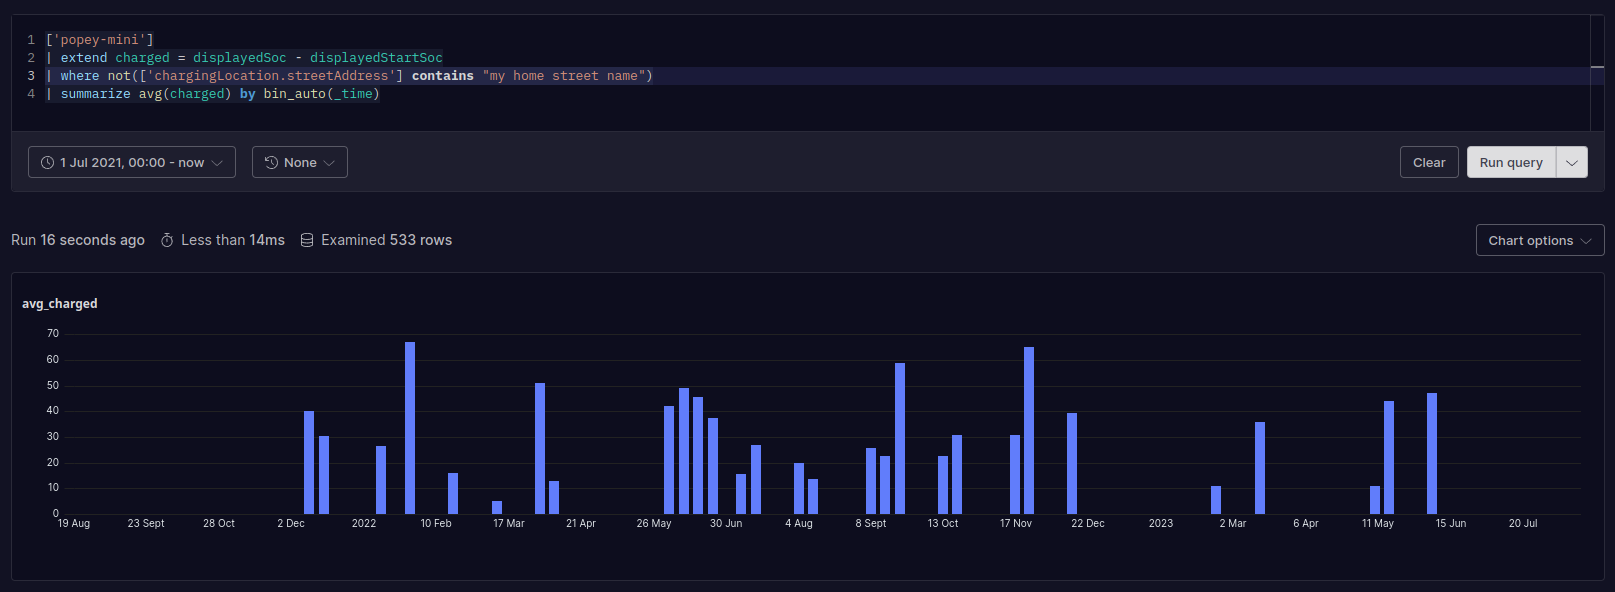
Away
Compare the above with when I charge away from home, by simply inverting the where clause. I charge a ton more at home than away.
['popey-mini']
| extend charged = displayedSoc - displayedStartSoc
| where not(['chargingLocation.streetAddress'] contains "my home street name")
| summarize avg(charged) by bin_auto(_time)
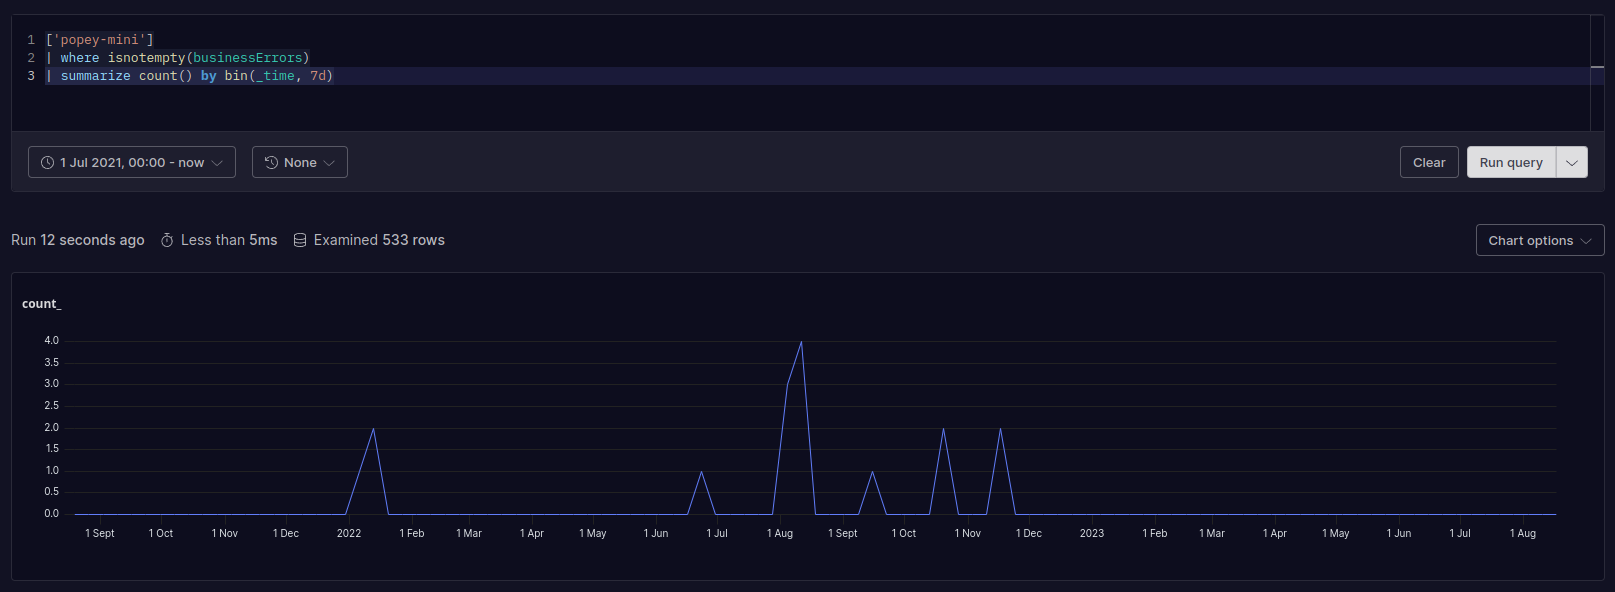
Failed charges
I’ve seen some negative press around the reliability of the public charging network. While I don’t have data about the chargers I never attempted to use, because they were clearly out of order, I do have data for failed charge sessions. They show up in the data as “Business errors”.
A simple query returned sixteen of these errors. Interestingly, perhaps, if I filter on my location as above, I can see that half of these errors occurred away from home at public chargers, and the other half happened on my own charger.
['popey-mini']
| where isnotempty(businessErrors)
| summarize count() by bin(_time, 7d)
I did have some problems with the app provided by the charger manufacturer which we debugged. I suspect that accounts for most of the at-home charge errors.
Again, no accounting for unattempted charges at broken chargers, of course.
Completely dead battery
One question I get a fair amount is ‘Has your battery ever been completely dead?’.
I used this query to kinda answer that question. Where have I ever charged where the starting state was zero (which I’d consider pretty empty).
["popey-mini"]
| where displayedStartSoc == 0
| summarize avg(energyConsumedFromPowerGridKwh) by bin_auto(_time)
Looks like not often, twice in fact.
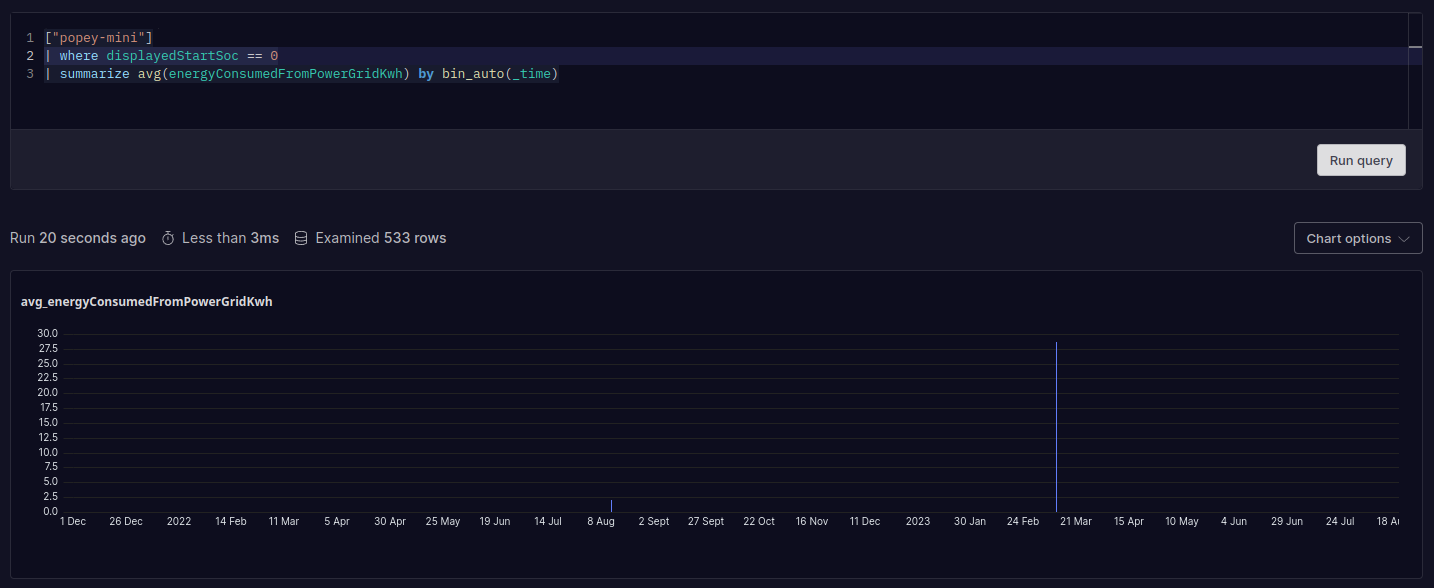
I know one of these was when I intentionally tried “hypermiling” and got it pretty much bang on zero as I pulled up at home. On the other occasion, my car was in the garage for repair, when the charging socket broke, so I was unable to charge it. I don’t often let it get that low.
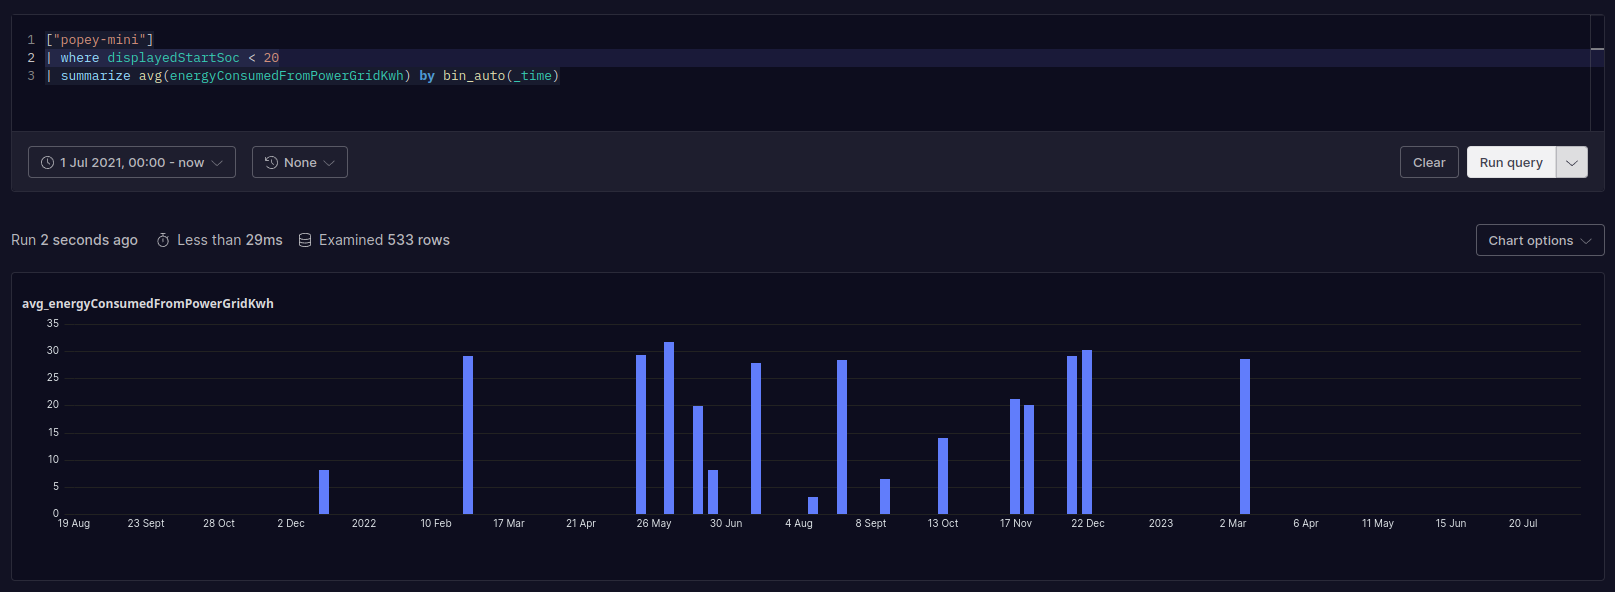
Indeed I don’t often let it get below 20%. I usually plug the car in every day, and let it automatically charge during the cheapest time from 23:30 to 05:30.
['popey-mini']
| where displayedStartSoc < 20
| summarize avg(energyConsumedFromPowerGridKwh) by bin_auto(_time)
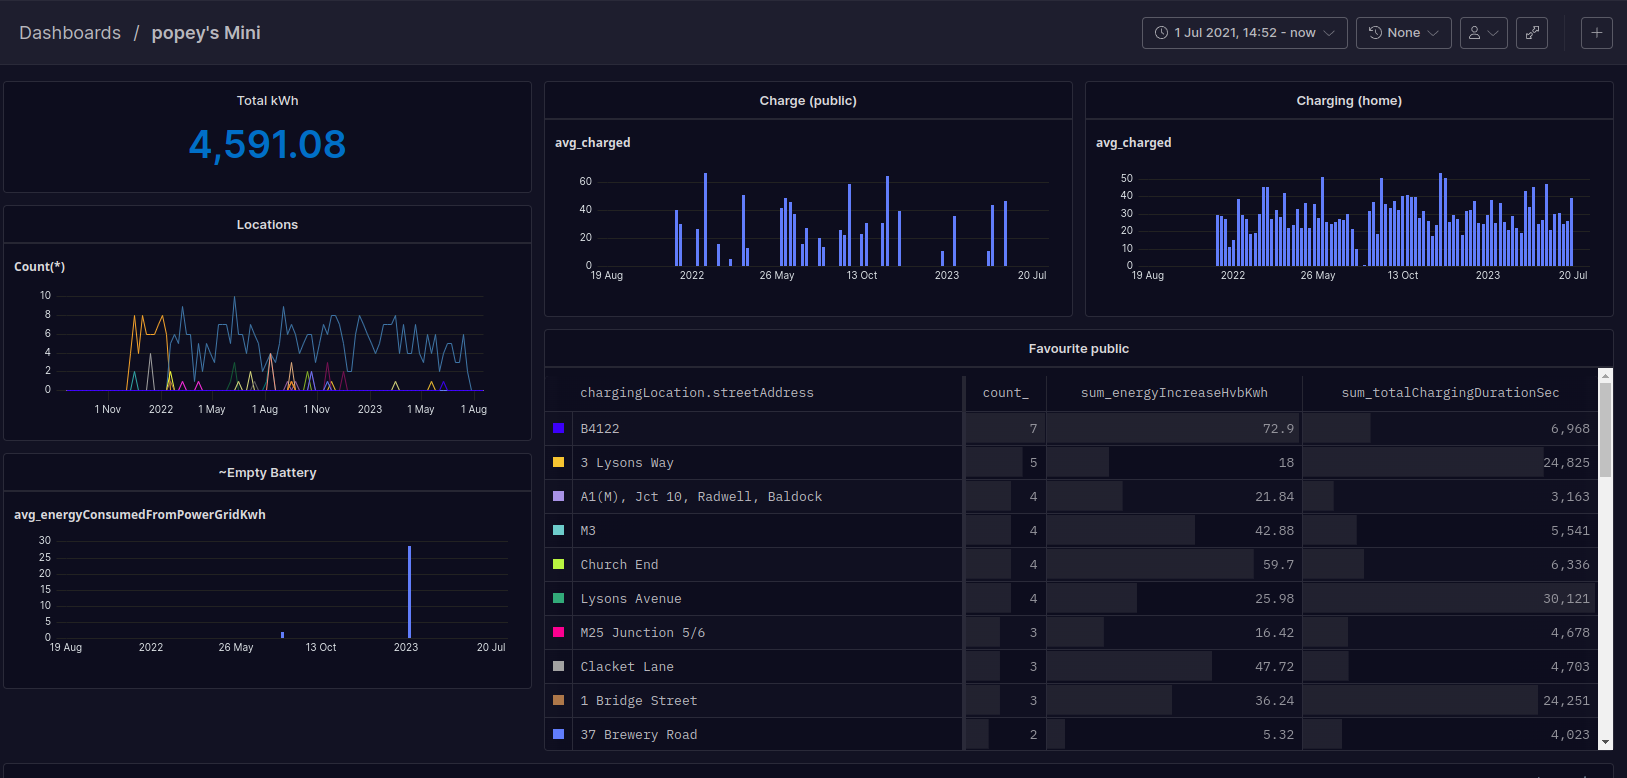
Building a dashboard
Once I had a few working queries, I could add them to a dashboard.
Queries
Here’s some of the APL queries I used to fill that dashboard.
Total kWh
Total kWh put into the car over the life I’ve had it. Nobody asks for this, I just found it a fascinating data point. Perhaps people could use this along with the total fuel used in an ICE car over the same period, and calculate the carbon footprint comparison.
¯\_(ツ)_/¯
['popey-mini']
| summarize sum(energyIncreaseHvbKwh)
Favourite chargers
I kinda expected the Chippenham services to be highly ranked here because I remember using it a few times.
['popey-mini']
| where not(['chargingLocation.streetAddress'] contains "my home street address")
| summarize count(), sum(energyIncreaseHvbKwh), sum(totalChargingDurationSec) by ['chargingLocation.streetAddress']
Interesting notes
Having the visualisation of how much I charge at home vs away was helpful for me to illustrate the proportions of charger use.
The main thing I found interesting was the different locations I’ve charged at away from home. There are a few records for “Lysons Way” which happens to be where the BMW service centre is located. My car went in for repair on a couple of occasions, so it was likely charged there while being repaired.
That location alone accounts for at least nine charging attempts away from home, and that’s not even something I did. Nor was there any cost (to me) associated with them.
The “B4122” entries rank as my most ‘popular’ charging spots as measured by the number of visits, and how much energy was used. This is the lovely Chippenham pit stop. They do a great breakfast and have a bunch of chargers - as seen in the photo at the top of this blog. I visited there multiple times while being ‘dad cabs’ taking my Son to visit a friend in Wales.
The data cleanliness wasn’t great. For example, the BMW garage shows as “Lysons Avenue” and “3 Lysons Way” whereas Clacket Lane Services on the M25 shows as “M25 Junction 5/6” and “Clacket Lane”. I could probably have cleaned this data up before importing. Indeed, I can easily delete all the data in the Axiom dataset, clean the data up locally, and re-upload with curl again.
Future ideas
I should add a query to show the duration of charging when at a public charger. It might highlight which chargers are ‘fast’ or ‘slow’ in a visual way.
The dataset also has entries for when a charging failure occurs. This isn’t very often but might be interesting to chart the locations where failures often happen.
The dataset has GPS data for the location of charging, but the Axiom charting system doesn’t (yet) have mapping as an option. Maybe that could be added, or I could chart that externally using OSM/Gmaps or some open-source tool like LeafletJS.
I’d like to get pricing data in, so I can see and report on how much I spend on public chargers. This isn’t super important for me, as we have learned, I don’t use public chargers as much as some do.
The JSON data dump from BMW doesn’t contain mileage data. It would have been interesting to see miles between charges, miles per day and other distance-related queries.
I’d also like to regularly get more up-to-date data, rather than just a snapshot once in a while. That requires registering with BMW for API access, it seems. Something else to look into.