The other day I wrote about snapcraft metrics, a tool that enables publishers to extract application metrics from the snap store. Something I’ve noticed which I wanted to share, was how quickly automatic updates roll out to an application’s user base.
So I took the metrics from an application that I published in the snap store and scrubbed the names and version numbers. I charted below the speed that devices roll over from one release to the next. Here’s an image that I think clearly shows the rapid rise as a new release is published, and the rapid drop-off, of the previous version. This chart covers a month where three versions were published, a week or so apart.
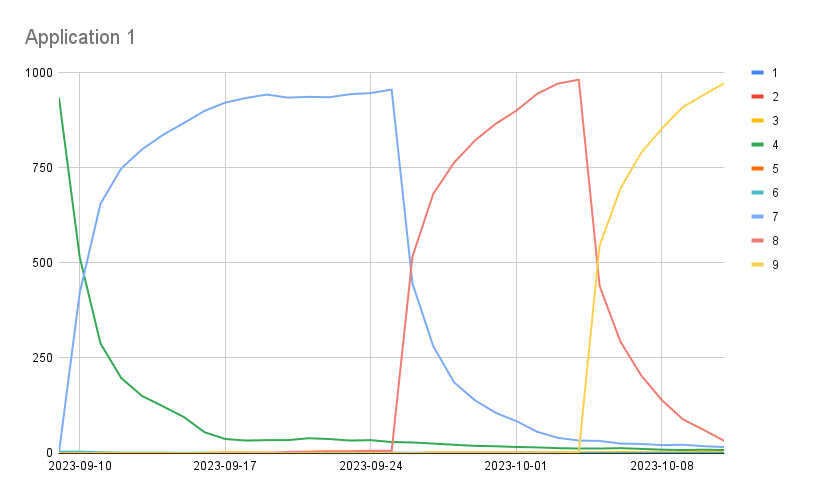
This is a desktop application with around a thousand users. So it’s not incredibly popular, but I think it’s a significant enough userbase to illustrate my point. There have been nine releases, some of which are quite old. The latest release was published to the edge channel on Wednesday 4th, then the stable channel last Thursday, the 5th.
Only a few people subscribe to the edge channel - unsurprisingly - because that could contain sharp objects and broken software. So it’s quite common to see a low quantity of those adventurous users get the updates first. Then the application was published to the stable channel, where everyone else gets it.
Within a single day, over half the devices had been updated. By the following week over 90% of the devices had moved to the new release. Here’s the data for just the last week of the graph. The numbers wobble about a bit from day to day, which is pretty normal. Not everyone turns their PC on every day. Not seen here, but there is often also a notable drop on weekends and public holidays. But the numbers are stable enough to illustrate my point.
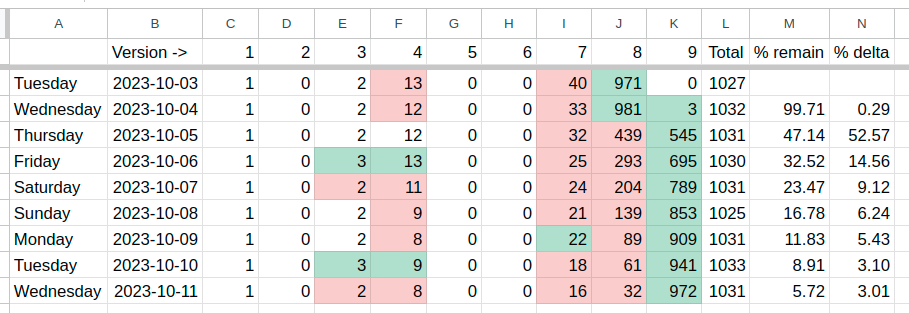
Let me explain the columns. The green and red are just to highlight when a number is going up (green) or down (red).
- 1 through 9 - simplified version numbers of the application
- The numbers in the grid are the quantity of users/devices on those versions
- Total - the sum of all users on all versions
- % delta - percentage of machines updated to version 9 that day
- % remain - percentage of machines are still on versions 1 through 8 which have yet to update
You can see only three people updated to version 9 on Wednesday 4th October - those were the edge channel subscribers. The bigger jump came the next day when the app hit the stable channel, as I mentioned.
Worth noting that snapd will only be able to update these applications when they’re closed. So if a user leaves the application open for long periods, then they may not get the update as promptly as someone who reboots every day. In column E for example, we can see the number of users of version 3 of the software goes up and down.
There’s plenty of plausible reasons why that might happen. For example it could be that someone turned their machine on for the first time in a while on Friday, so counted as an ’extra’ user, then got updated that day, so the count for that version goes down again the next day. Or maybe they only use the computer on Fridays. No idea.
Also worthy of note is that it’s possible to defer and disable updates, which a minority of people do. What’s fascinating here then is the ‘stickyness’ of people on the older releases. I expect eventually most of the users will upgrade, but maybe some never will if they disabled updates. That’s their choice of course.
I’ve seen this pattern very reliably reproduced across any kind of application I’ve published in the snap store. Whether the app has ten, a thousand or a hundred thousand, the pattern is pretty much the same:
In general, 50% of users will update within 24 hours, and 90% are updated within a week.
While I know the whole concept of automatic background updates is anathema to some, it’s certainly useful for keeping most machines up to date, and on the latest and greatest code. With all the security fixes, and potential new bugs that come with it.