I was a guest host on Late Night Linux podcast, episode 249 last week, filling in for Will. We each bring along a ‘discovery’, I brought snapcraft metrics to talk about. I thought I’d write up how I use them, for listeners of the show as it’s hard to articulate this very well verbally.
My snaps
I have about twenty snaps in the snap store. Some, like Bombsquad and ncspot have been published for years now. Others such as Classicube were more recently built and published.
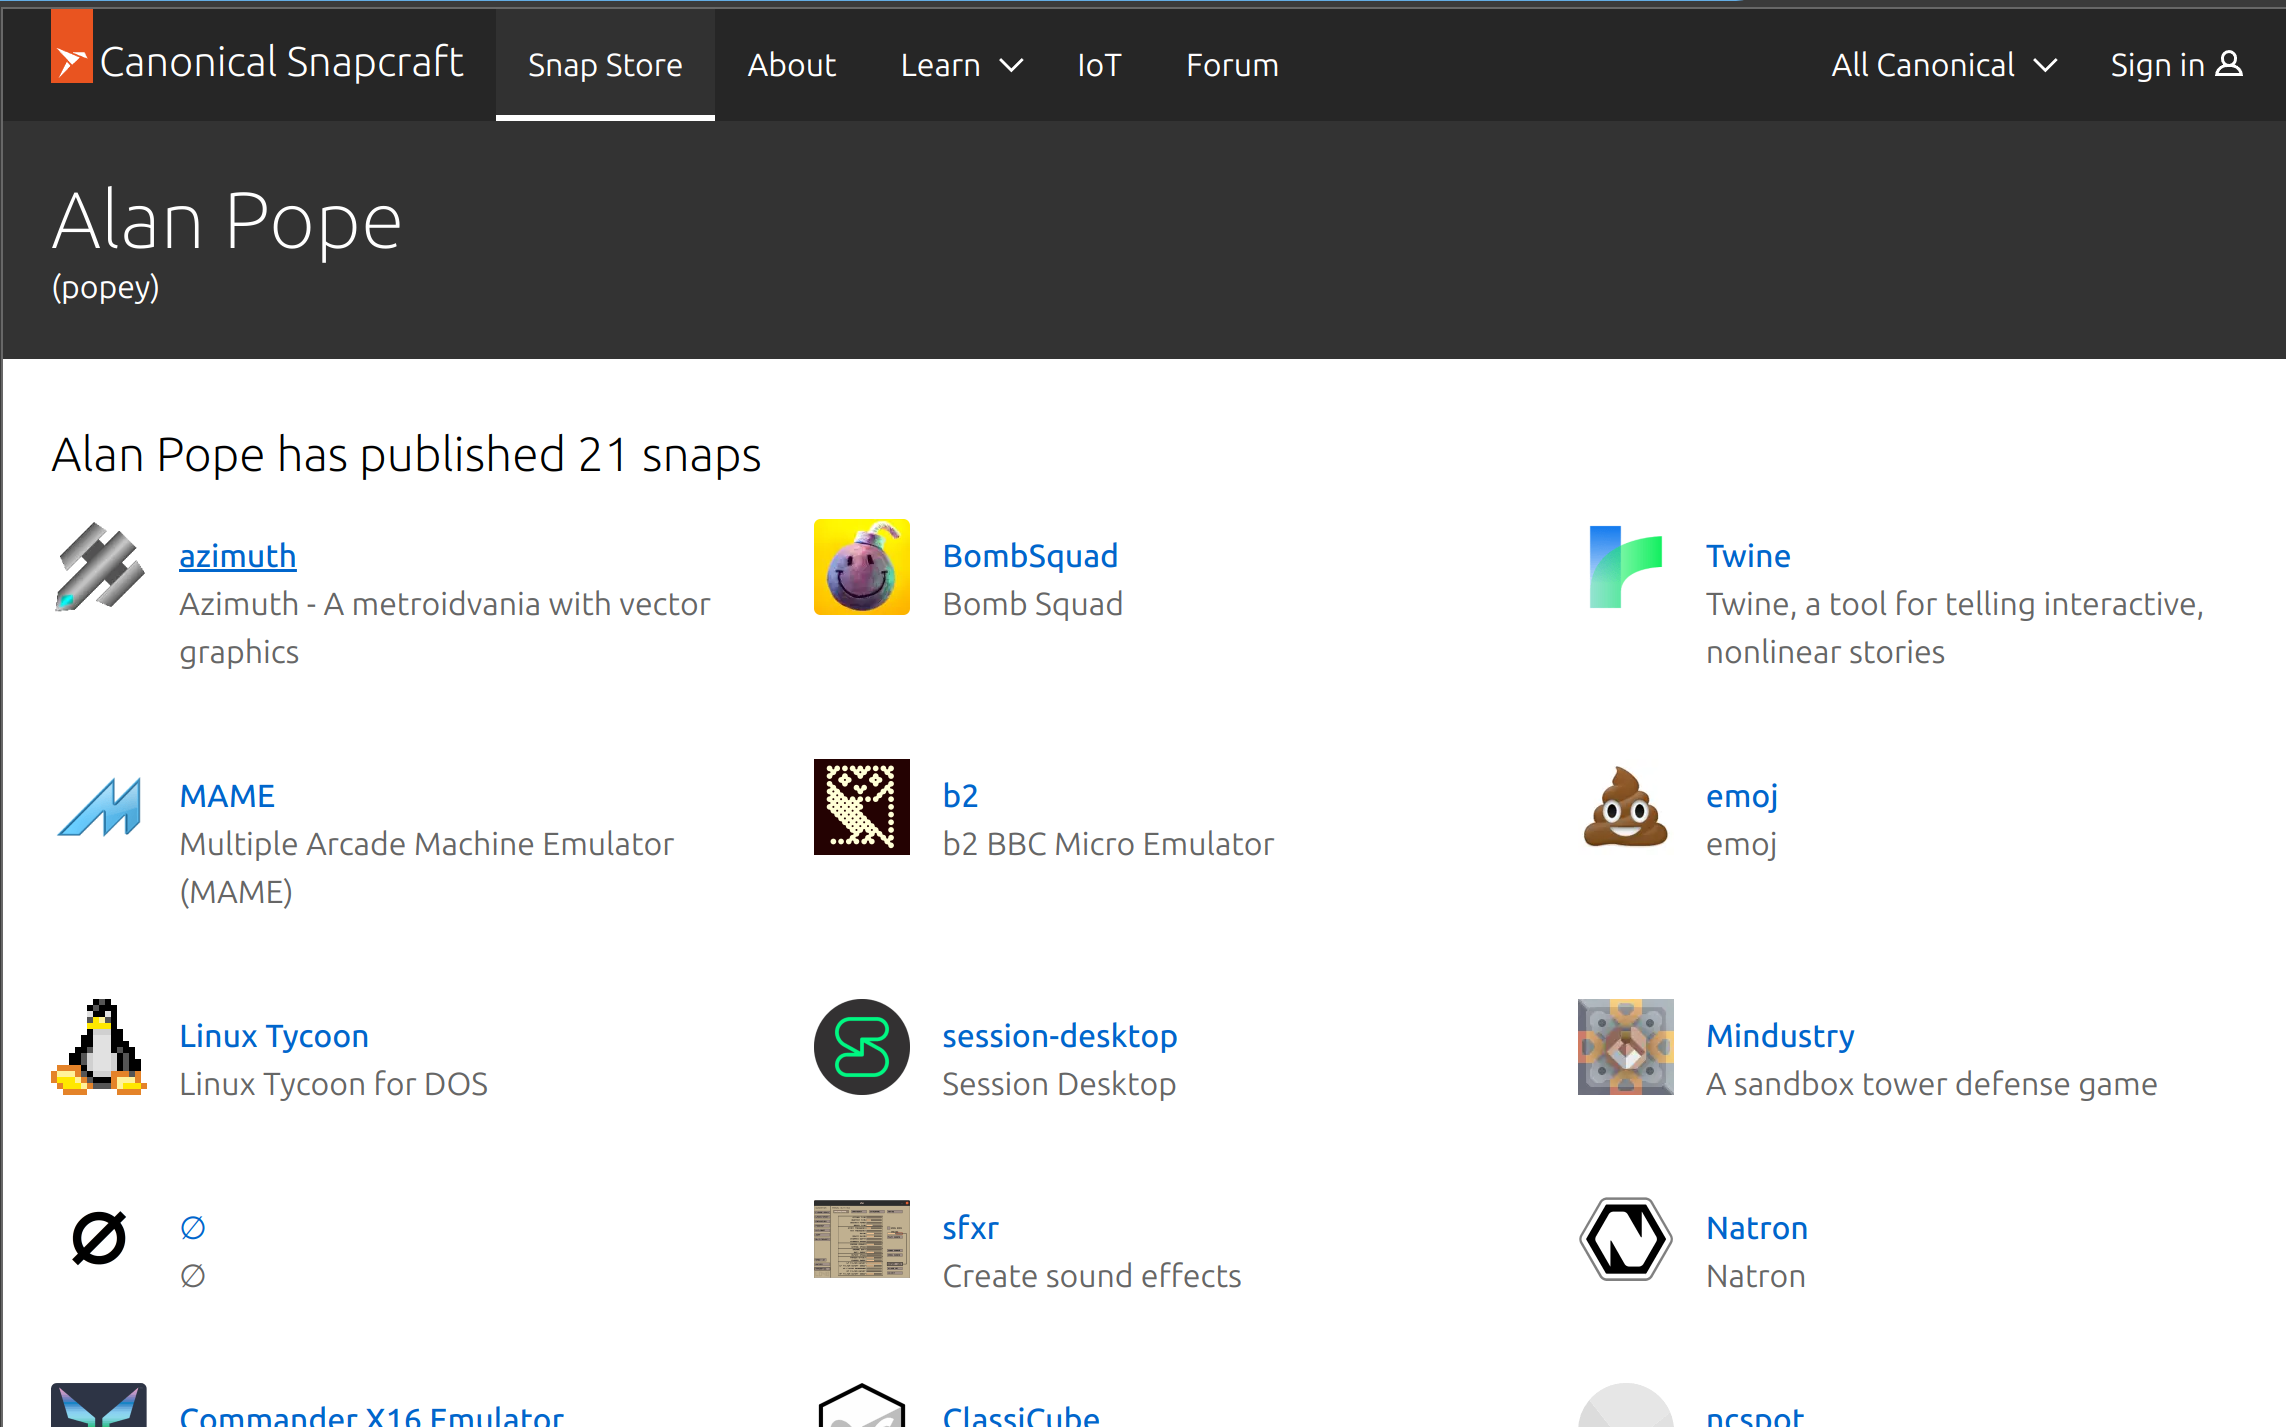
When I left Canonical in 2021, suffering a little snap-burnout, I asked on the snapcraft forum for help in maintaining some of them. Thankfully some people stepped up and helped. But a lot of them are still under my publishing control.
I’ve recently been re-examining them, updating them and fixing issues. Beyond the twenty-or-so public, up-to-date snaps, there are another twenty more that need some work.
Your month in snaps
Every eighth of the month, all snap publishers get an email. I’ve been getting these every month for the last five years! They’re a good reminder that there are actual computers out there, with your work on them.

It lists each snap you have published, along with the channels, released versions, and interestingly, the number of “weekly active devices”. It only lists released snaps with more than 10 users. So a prototype snap which only the developer has installed, won’t show up in the stats.
Typically a publisher will only have a small number of snaps in the store. I’d imagine the vast majority have exactly one published snap. The average goes up when you consider organisations like KDE with 161 snaps, and companies such as JetBrains with 16.
Store metrics
Every machine running snapd, and having snaps installed, will check-in with the snap store periodically. Some more periodically than others. By default a few times a day, snapd will see if any installed snaps require updates. It sends a unique generated machine ID along with the list of snaps and revisions currently installed. It also sends architecture information and details of the host OS.
The store can then reply with a list of available updates, that snapd can process. The store backend stashes the data about how many users, what OS and other data each snap has, and presents it to the publisher.
Let’s look at the graphs for one application I published, ’ncspot’. The ncspot app is a command line ’ncurses’ interface to Spotify. This is ideal for low-power computers, or those for which no ‘full fat’ Spotify client exists.
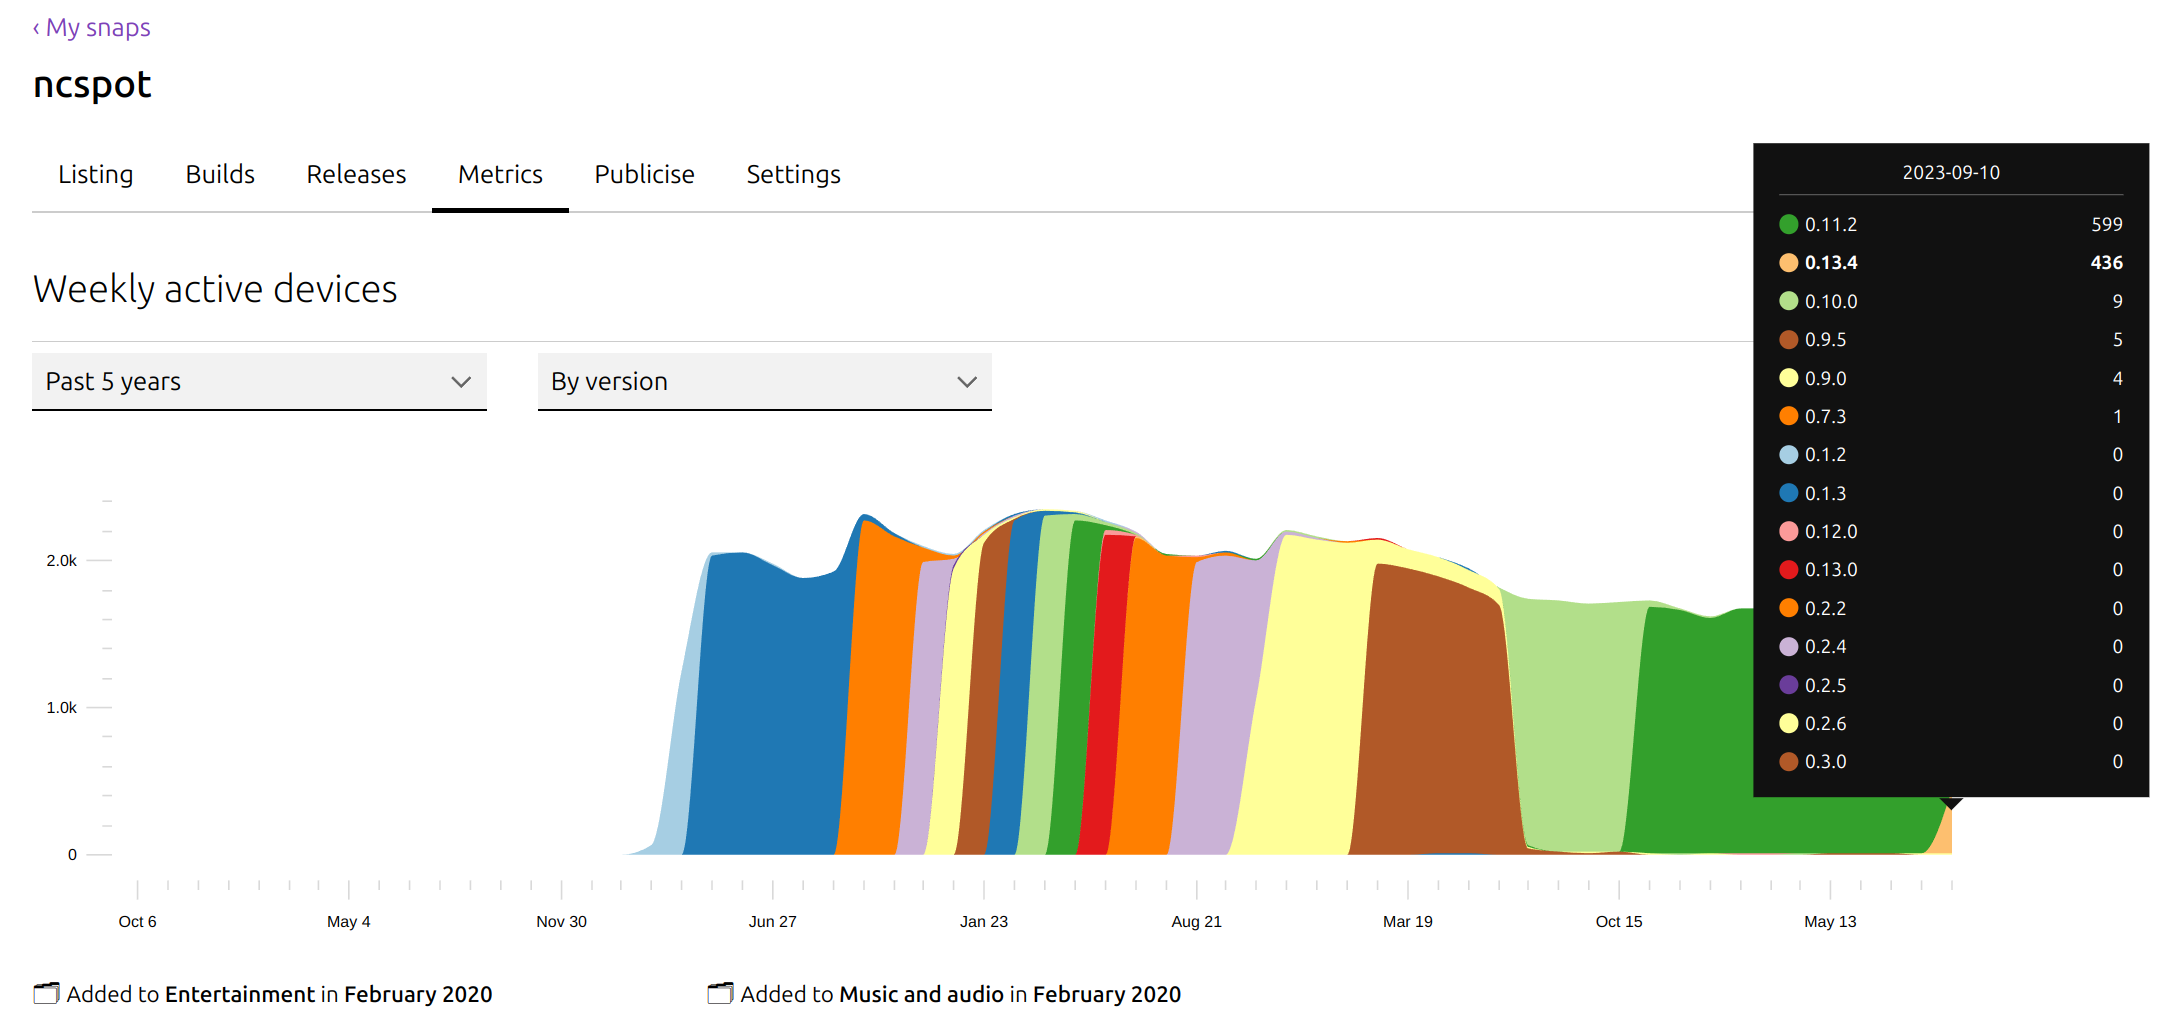
ncspot by version
I love this graph, clearly shows the automatic update of snaps in action. Each wave of colour depicts a new release of ncspot rolling out the users.
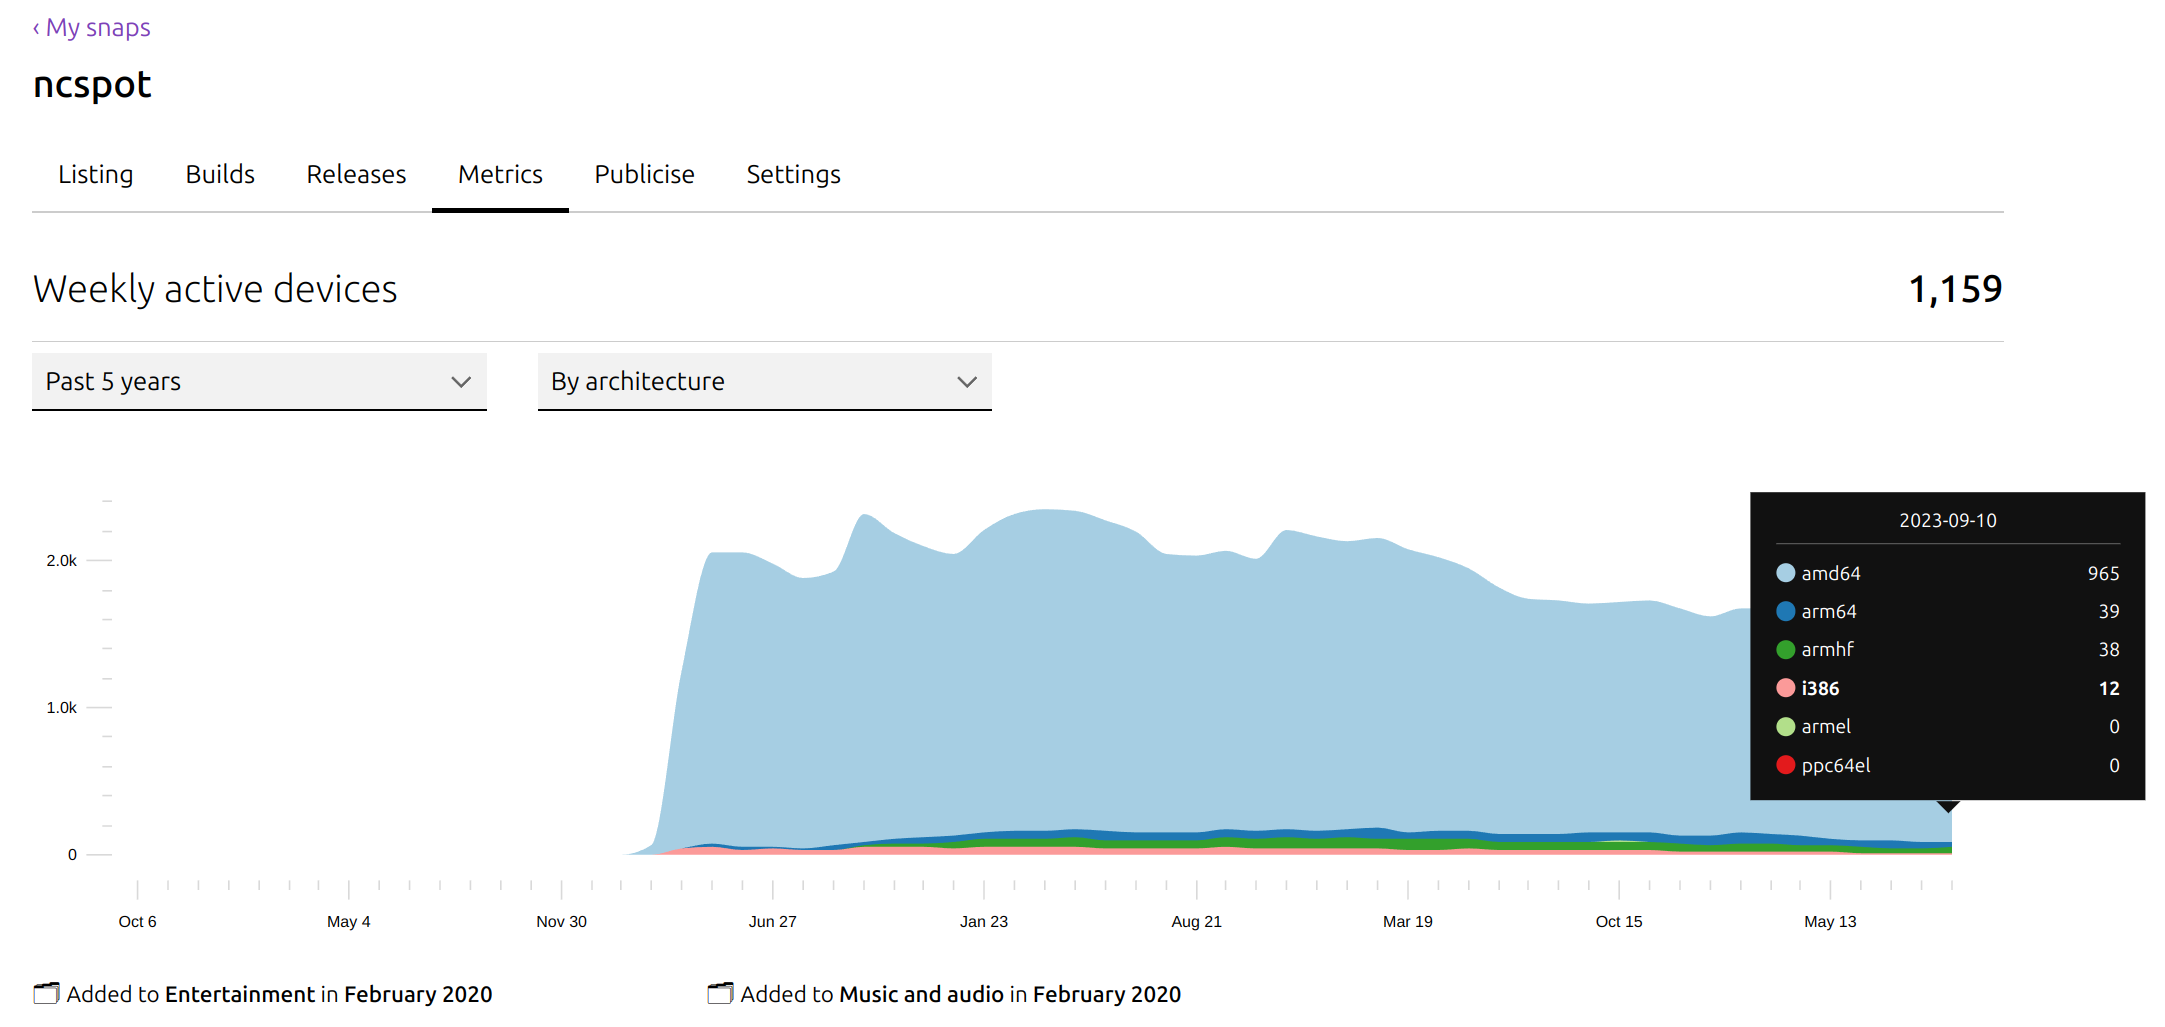
ncspot by architecture
Somewhere out there, there are a dozen machines with the 32-bit Intel “i386” architecture builds of ncspot! I imagine it’s one of the easiest ways to get a Spotify player on those computers.
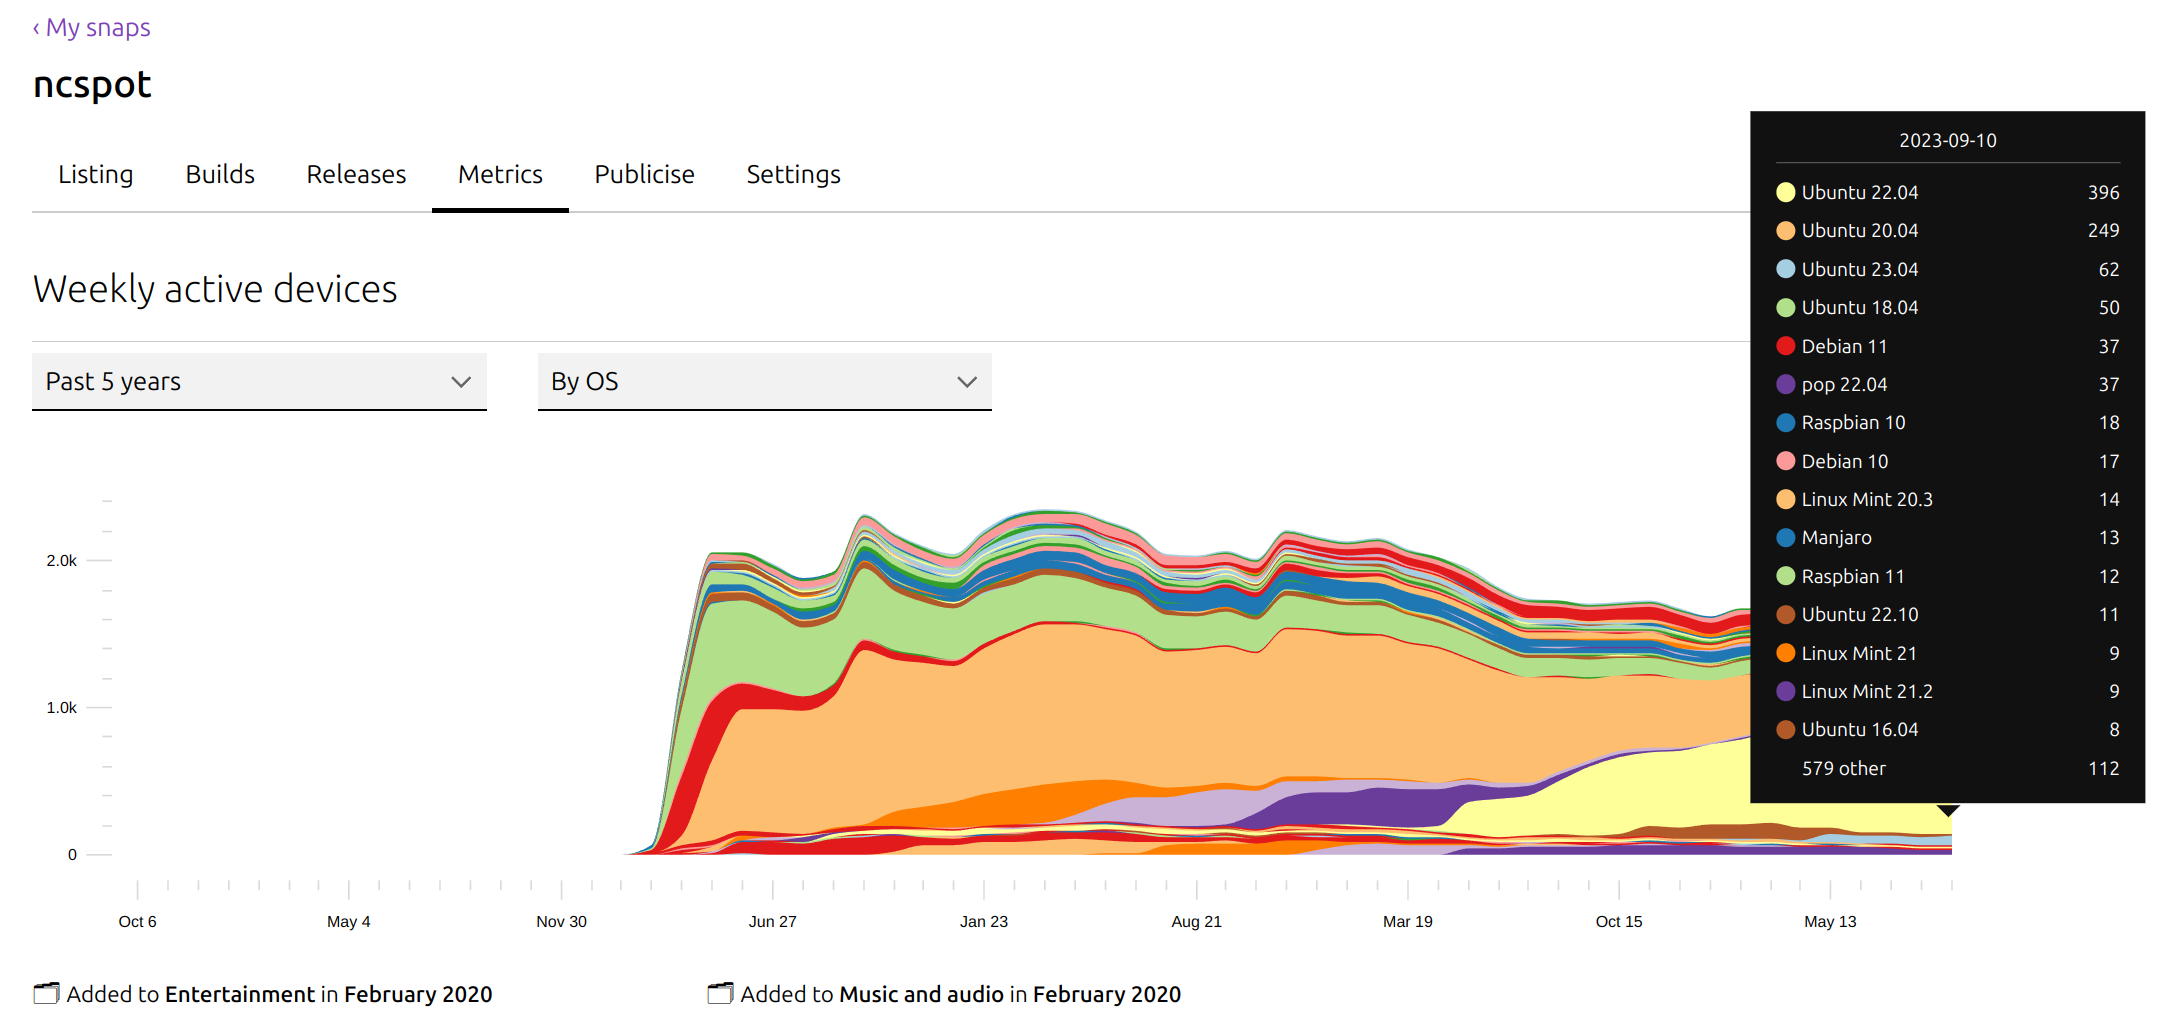
ncspot by os
This one always makes me smile. “But but but! Snaps only work on Ubuntu.”. Nope. Check this Google Sheet to see the other distros this snap is installed on. More on that below.
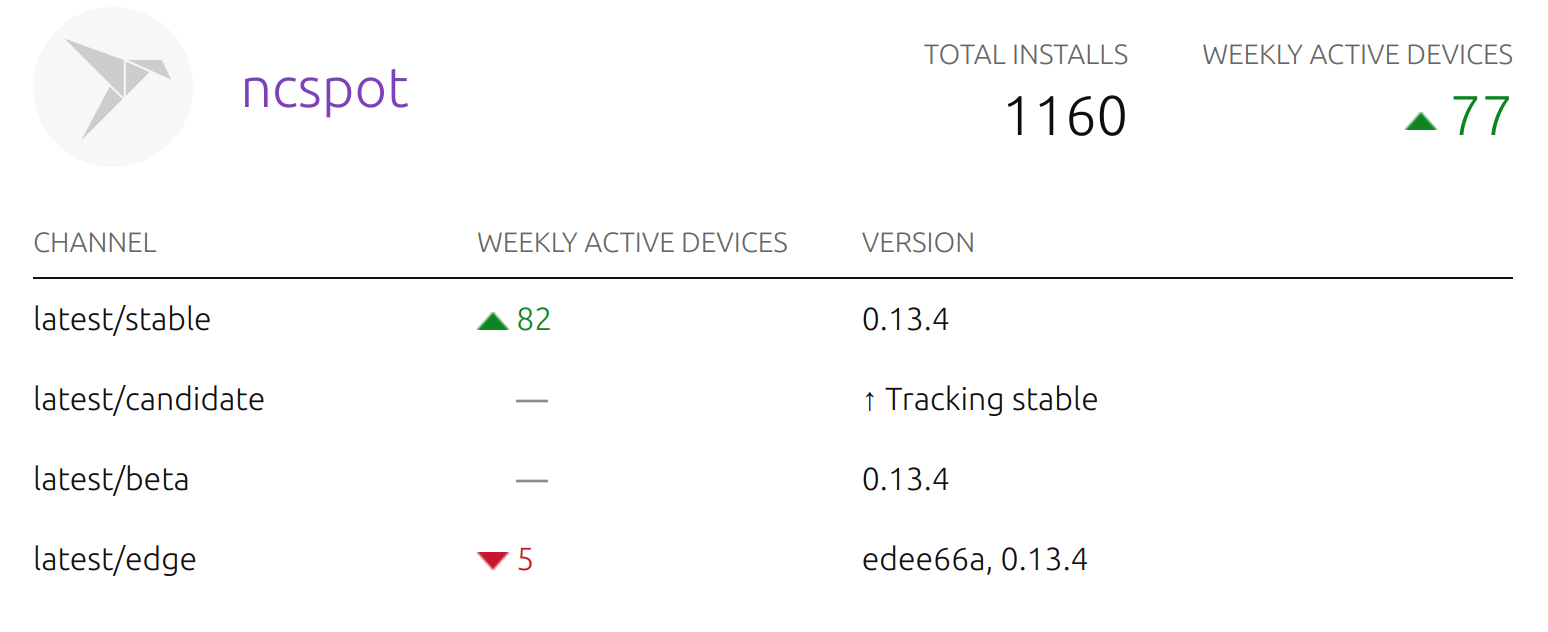
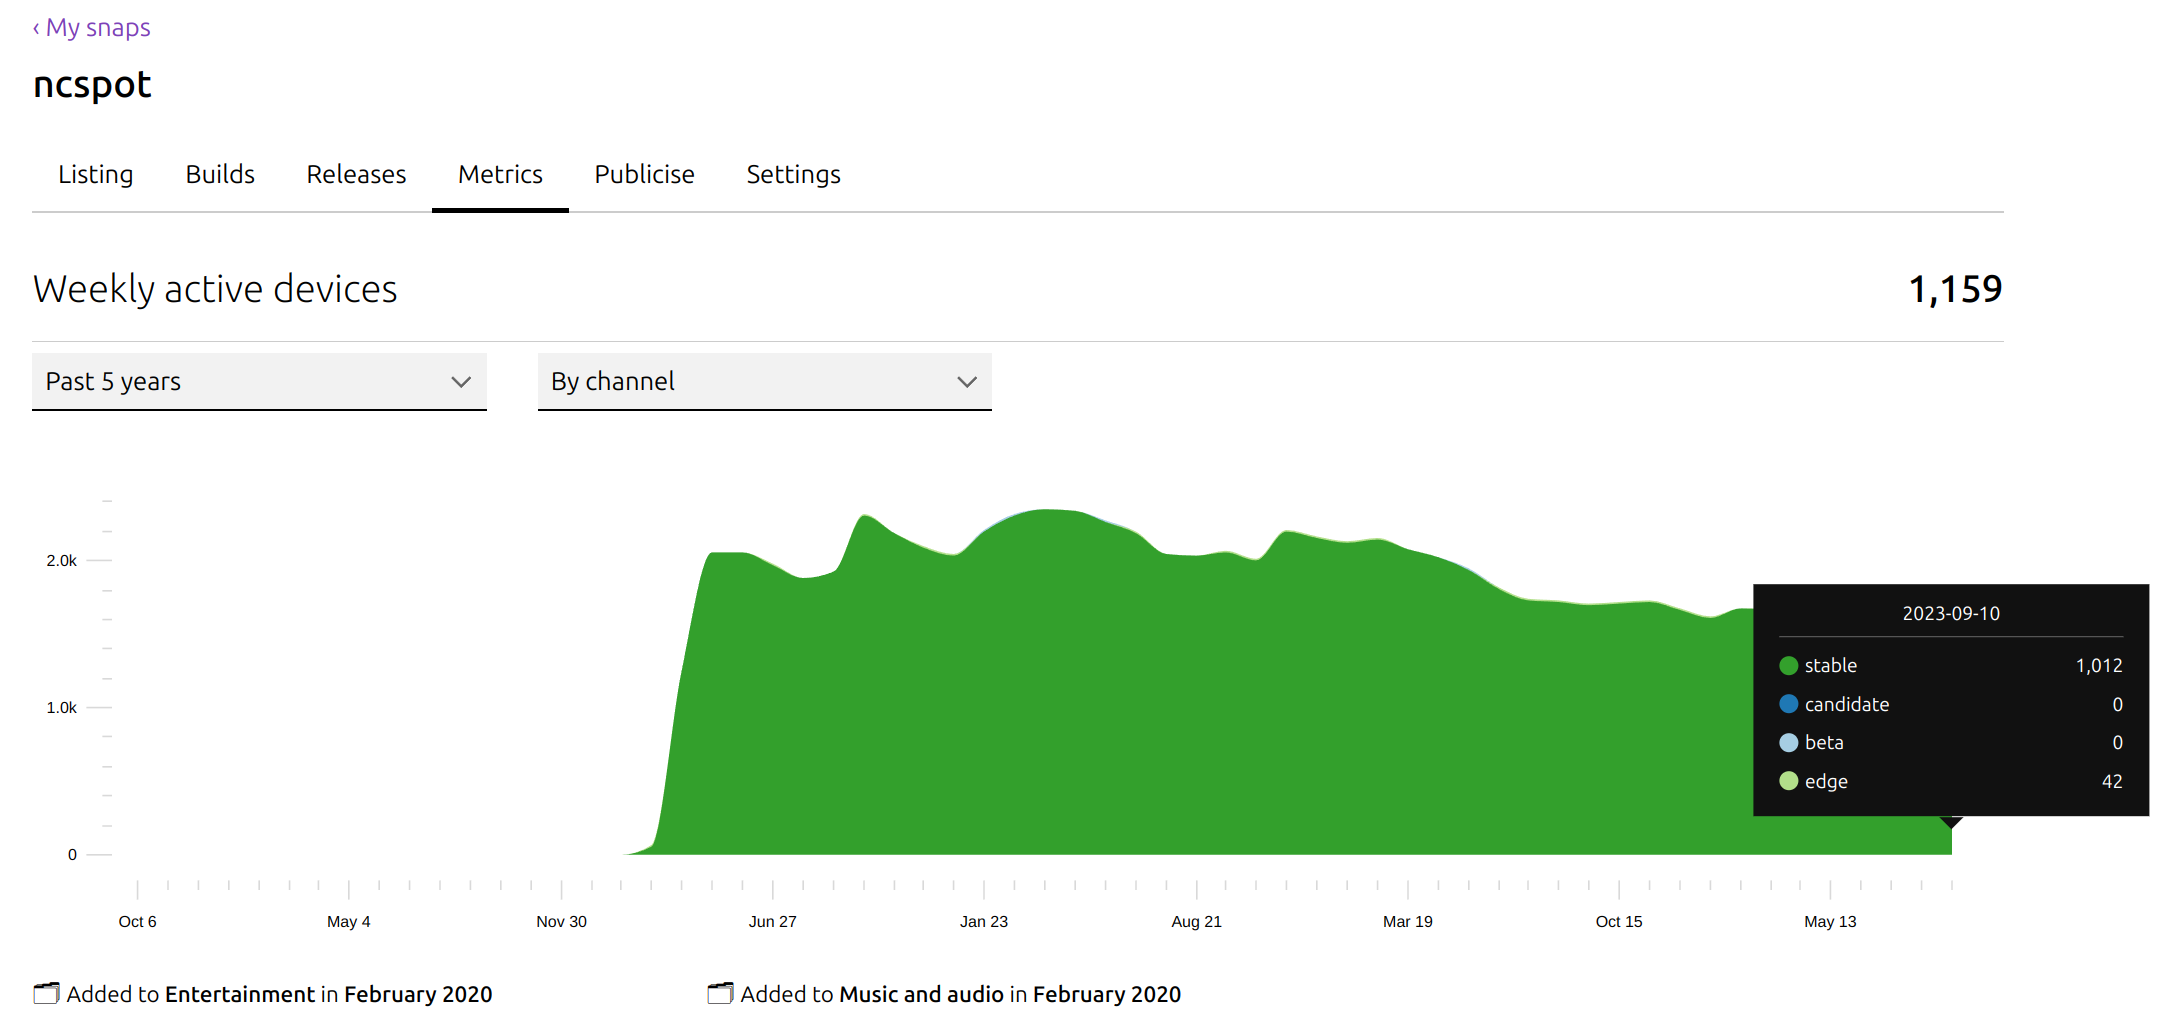
ncspot by channel
I love that some fourty intrepid souls are running edge builds of ncspot!
snapcraft metrics
While the graphs and emails are great, publishers may want to slice and dice the data themselves. So the snapcraft command has a metrics option, which enables publishers to grab current and historical metrics data for their applications.
It’s all documented in the snapcraft docs but here is an example. Here we query the store for “Installed base by OS” which “contains one series per operating_system representing the number of devices with the given snap installed.”. We grab the past 90 days data, with the output in plain text rather than json format.
snapcraft --verbose metrics ncspot --name installed_base_by_operating_system --start $(date +%Y-%m-%d -d "90 days ago") --end $(date +%Y-%m-%d -d yesterday) --format=table
Here’s a small snippet of the raw data that gets returned. This is w i d e. I have uploaded the full set to this publicly viewable Google Sheet or this text file.
OS                            2023-07-10  2023-07-11  2023-07-12  2023-07-13  2023-07-14  2023-07-15  2023-07-16  2023-07-17  2023-07-18  2023-07-19  2023-07-20  2023-07-21  2023-07-22  2023-07-23  2023-07-24  2023-07-25  2023-07-26  2023-07-27  2023-07-28  2023-07-29  2023-07-30  2023-07-31  2023-08-01  2023-08-02  2023-08-03  2023-08-04  2023-08-05  2023-08-06  2023-08-07  2023-08-08  2023-08-09  2023-08-10  2023-08-11  2023-08-12  2023-08-13  2023-08-14  2023-08-15  2023-08-16  2023-08-17  2023-08-18  2023-08-19  2023-08-20  2023-08-21  2023-08-22  2023-08-23  2023-08-24  2023-08-25  2023-08-26  2023-08-27  2023-08-28  2023-08-29  2023-08-30  2023-08-31  2023-09-01  2023-09-02  2023-09-03  2023-09-04  2023-09-05  2023-09-06  2023-09-07  2023-09-08  2023-09-09  2023-09-10  2023-09-11  2023-09-12  2023-09-13  2023-09-14  2023-09-15  2023-09-16  2023-09-17  2023-09-18  2023-09-19  2023-09-20  2023-09-21  2023-09-22  2023-09-23  2023-09-24  2023-09-25  2023-09-26  2023-09-27  2023-09-28  2023-09-29  2023-09-30  2023-10-01  2023-10-02  2023-10-03  2023-10-04  2023-10-05  2023-10-06  2023-10-07
Ubuntu/22.04                  310         302         310         313         299         245         243         294         300         289         285         262         229         232         279         293         279         282         284         237         234         285         298         288         293         295         248         244         292         293         297         286         290         229         232         279         273         291         280         262         228         236         298         288         282         283         268         238         244         291         291         295         309         303         226         248         303         308         302         295         279         223         246         298         307         287         316         308         263         252         320         319         320         313         305         251         258         314         312         313         316         312         259         265         323         325         316         312         296         251
Ubuntu/22.10                  13          13          13          15          12          9           12          14          13          15          14          11          10          8           13          13          12          12          11          9           10          12          14          10          12          14          7           9           10          10          13          11          10          10          9           8           9           7           7           7           10          7           9           7           7           5           10          5           7           8           6           7           7           7           5           5           6           7           7           5           7           6           7           6           5           6           8           6           4           3           6           3           3           4           3           4           3           4           4           5           4           4           4           4           4           2           3           3           3           1
I’ve put a snapshot of all the metrics data for every snap I publish here in case anyone is interested. They’re all pretty small-fry numbers compared to some of the high-profile applications in the store. But seeing any number of machines installing this stuff I maintain is motivational to me!